>BPCL :
>
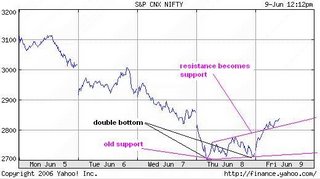
>Today it has broken strong support of 340 also.Will it test the Double Bottom of 305 or so?
>What are your expert view?Can we short tomorrow?
>What are your expert view?Can we short tomorrow?
With SL341 one might think of going short (But it seems too late)
Well now there is next level of learning "Which I am also trying to learn"
Everyone have a mind set problem: (I am working on it)
So the lesson goes this way (Not very well understood by me hence just a thought kind of post)
Its obvious that if our assumption is proven wrong then the stock will go other way.
That is if your stop loss is hit reverse your position from long go short. In BPCL that might have
worked well.
The issue here with me is if I have a mind set that market is bullish I do not take short position.
Many people would have this problem. If I already have a history of making money on a stock
which had a good bull run and I had a long position yesterday how come suddenly I liquidate
my long position and take short position.
But I have heard that there are people using stop-loss orders to take positions. (I do that in only
breakout condition and that to in the direction which I predict not the other way).
ANY HARDCORE TRADER ON THIS GROUP WOULD BE ABLE TO SHARE.